Low-Cost Massive MIMO: Pilot Length and ADC Resolution
Qiao Dan( ),Yang Xi(),Tan Weiqiang(),Wen Chaokai(),Jin Shi()
),Yang Xi(),Tan Weiqiang(),Wen Chaokai(),Jin Shi()
.
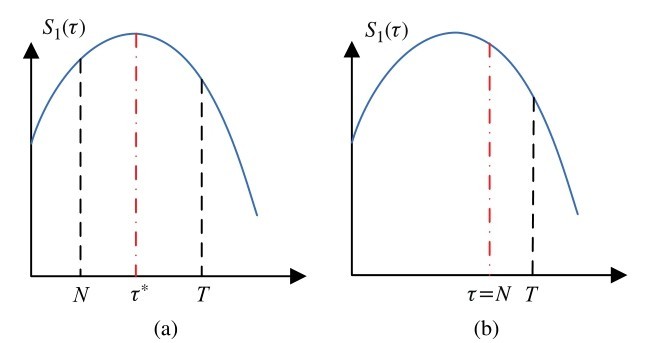
Figure 3. The different trends of sum SE