| [1] |
REICHMAN O J , JONES M B , SCHILDHAUER M P . Challenges and Opportunities of open data in ecology[J]. Science, 2011,331(6018): 703-705.
|
| [2] |
怀进鹏 . 大数据是国家战略资源[J]. 中国经济和信息化, 2013(8): 49-50.
|
|
HUAI J P . Big Data:national strategic resource[J]. China Economy& Information, 2013(8): 49-50.
|
| [3] |
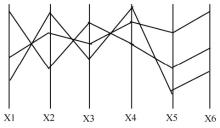
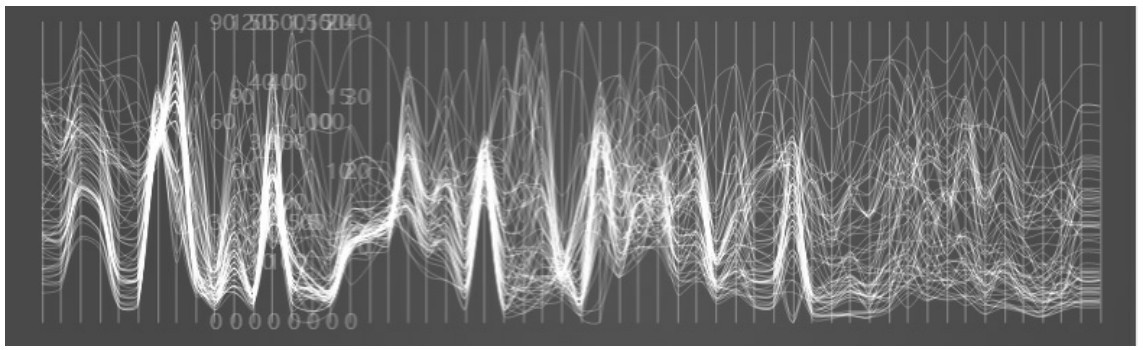
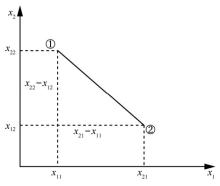
高芳 . 平行坐标可视化技术的度量模型研究[D]. 北京:北京交通大学, 2009.
|
|
GAO F . Research on measurement model of parallel coordinates visualization technique[D]. Beijing:Beijing Jiaotong University, 2009.
|
| [4] |
胡俊, 黄厚宽, 任东怀 . 一种基于图标技术的可视化方法与应用[J]. 北京交通大学学报, 2006,30(5): 10-14.
|
|
HU J , HUANG H K , REN D H . An icon_based visualization approach and its applications[J]. Journal of Beijing Jiaotong University, 2006,30(5): 10-14.
|
| [5] |
ITOH T , YAMAGUCHI Y , IKEHATA Y ,et al. Hierarchical data visualization using a fast rectangle-packing algorithm[J]. IEEE Transactions on Visualization & Computer Graphics, 2004,10(3): 302-313.
|
| [6] |
CHEN P , JIAO L , LIU F ,et al. Dimensionality reduction of hyper-spectral imagery using sparse graph learning[J]. IEEE Journal of Selected Topics in Applied Earth Observations & Remote Sensing, 2016,PP(99): 1-17.
|
| [7] |
INSELBERG A . Parallel coordinates[J]. Encyclopedia of Database Systems, 2009,43(4): 199-233.
|
| [8] |
解坤, 张俊芳 . 基于 KMO-Bartlett 典型风速选取的 PCA-WNN短期风速预测[J]. 发电设备, 2017,31(2): 12-36.
|
|
XIE K , ZHANG J F . Short-term wind speed forecasting using PCA-WNN based on KMO-bartlett typical wind speed selection[J]. Power Equipment, 2017,31(2): 12-36.
|
| [9] |
WANG J . Forecasting stock market indexes using principle component analysis and stochastic time effective neural networks[J]. Neuro Computing, 2015,156(C): 68-78.
|
| [10] |
HASHEMINEJAD S M H , JALILI S . CCIC:clustering analysis classes to identify software components[J]. Information & Software Technology, 2015,(57): 329-351.
|
| [11] |
段明秀 . 层次聚类算法的研究与应用[D]. 长沙:中南大学, 2009.
|
|
DUAN M X . Research and application of hierarchical clustering algorithm[D]. ChangSha:Central South University, 2009.
|
| [12] |
JAIN A K . Data clustering:50 years beyond K-means[J]. Pattern Recognition Letters, 2010,31(8): 651-666.
|

 ),Shui-bo WANG2,Qing-qi PEI2,Yang ZHAN2